April 8, 2022
What Is the Difference Between Reporting and Analytics?
Data is the pillar upon which successful businesses are built. It used to be limited to technology companies, but now businesses from all industries use data to develop better marketing strategies, produce better products, improve customer experience, and much more.
However, there is an abundance of data that businesses can collect, and not all of it is useful. As a result, decision makers rely on reporting and analytics to make sense of data and improve operational efficiency and productivity.

What is Data Reporting?
Reporting is the process of collecting, organizing, and presenting operational data in user-friendly and digestible reports. The information gathered is related to specific daily business operations such as sales, payroll, inventory, and so on.
However, because these reports are designed to make data accessible in the quickest and most efficient way possible, the insights they provide are often limited. Consider them as a way to understand what is happening in your day-to-day operations, rather than why it is happening.
Companies generate a variety of reports, including financial reports, accounting reports, operational reports, market reports, and others. This allows managers and business-owners to study the performance of each function quickly.
Creators of these reports extract the data required to build them from operational systems, also called transaction systems. Operational systems are software packages that enable organisations efficiently execute business processes. Popular types include ERPs (Enterprise Resource Planning) and CRMs (Customer Relationship Management). The data generated by these operational systems become the source data for your reports. Oftentimes, these operational systems come with structured reporting features that give rudimentary summaries of activities in just that system.
Users may need to build more robust reports that combine historical data from multiple sources. For this, users typically resort to manually combining these data sources using a spreadsheet like Excel or other analytic tools like Tableau and Power BI to generate their reports.
A great practice to improve reporting outcomes is to use a standardized methodology for visualizing data, such as the IBCS (International Business Communications Standards).
Here is a typical report generated using these standards:
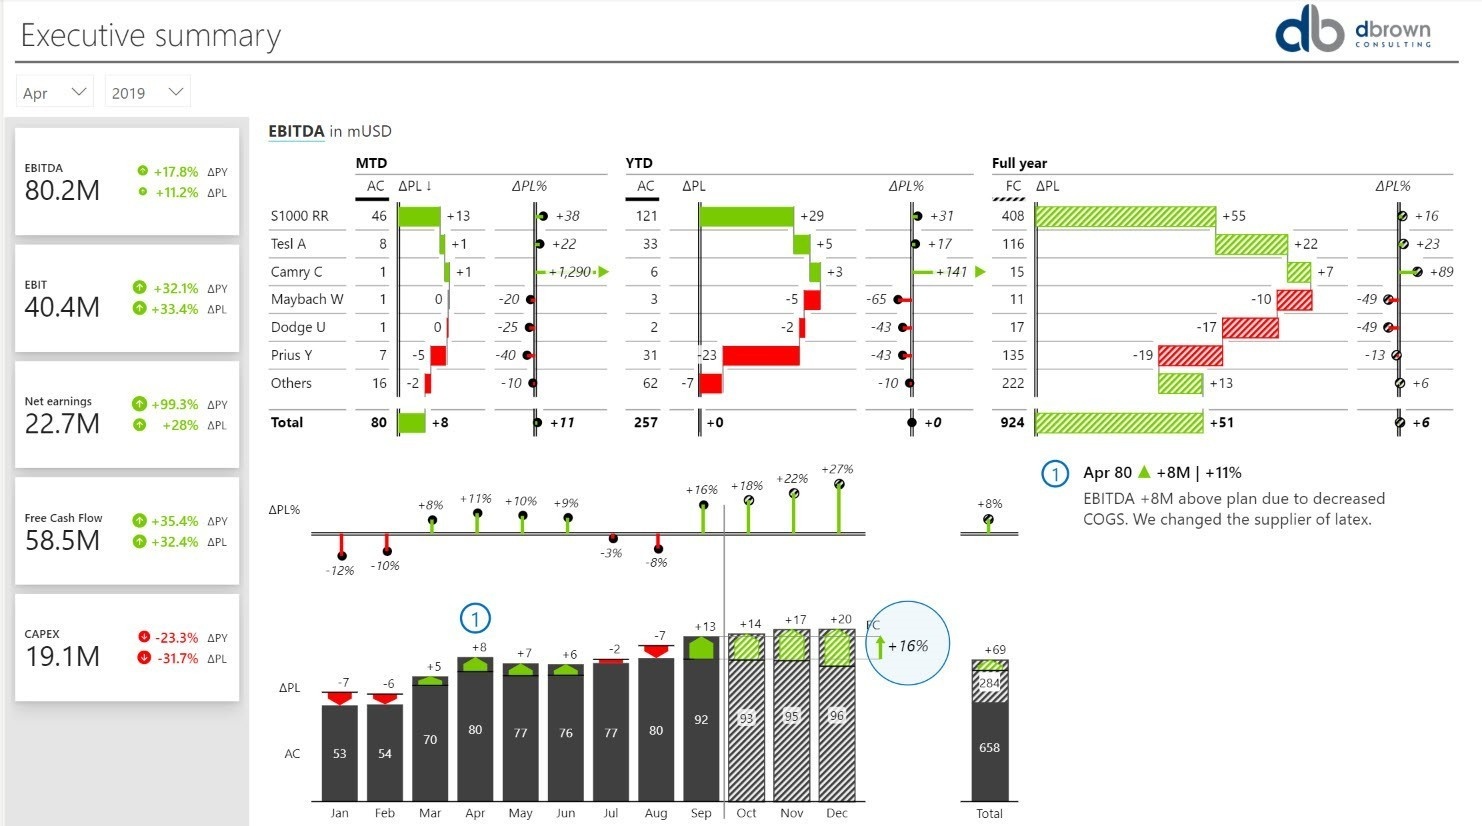
Source: Analytics Using Zebra BI Power BI Custom Visualisation
Every department in a company will use the data differently. For efficiency purposes, there should be a self-service approach to usage, ensuring that each department within the company can generate its own reports without the additional help of a dedicated IT team. Many of these operational systems allow users to export data to Excel or CSV files that can then be used to supplement the report with additional data if the tool cannot provide it.
What is Data Analytics?
While reporting is used to format and present historical data in an easy-to-understand format, analytics is used to compare and interpret data to help in the decision-making process. It gathers data from various operational systems to determine why the data is the way it is.
Analytics is about asking questions, examining, comparing, and interpreting the data. Perhaps most crucially: analytics should make it easy for you to recognize patterns. When combined with huge volumes of data from multiple sources, analytics can predict future trends and help generate more accurate forecasts.
The data analytics process is all about studying historical and current data using statistical modeling, algorithms, and data visualization to gain valuable insights, detect trends, and help make informed decisions about your future direction.
Have you ever suspected that a line item in your dataset may be a key driver for changes in another variable? Data analytics helps you determine how items are related, also known as correlation. Discovering these relationships is the holy grail of data analytics. Choosing the right visuals goes a long way in showcasing your analytics, enabling users to see and understand why changes have occurred and what can be done to improve.
Here is an example of this in action. We want to analyze the relationship between wealth and health as nations develop across the world.The animation below has plotted Life Expectancy on the Y axis as a proxy for health and Per Capita Income on the X axis as a proxy for wealth. We visualize this for the entire world from 1900 to 2008 (108 Years). For a global busines, NGO or government, the insights gained from this visualization is an invaluable guide to making better data-driven decisions. This is the basis of what data analytics is all about.
Source: Gapminder Bubble Tool
Historically, data scientists derived insights by manually analyzing spreadsheets and documents. Nowadays, they can use analytics software that leverage machine learning (ML) and natural language processing (NLP) capabilities to quickly identify relationships in your data and deliver more insights in a fraction of the time and with minimal cost.
Manufacturing companies are a good example of how data analytics can be useful. By recording the runtime, downtime, and work queue of their machines and then analyzing that data, they can better plan workloads and even predict downtime before it happens so that their machines are able to operate at peak capacity.
Analyzing the Difference Between Reporting and Analytics?
Conclusion
Knowing the distinction between the two is critical for taking full advantage of their potential. Some key differences include:
– Purpose: Reporting entails gathering data to gain a better understanding of the performance of a company’s various functions. Analytics is the ability to interpret data at a deeper level to make better decisions. For example, a company can use reporting to evaluate progress on various marketing campaigns, then use analytics to better prioritize them.
– Process: The key distinction here is that reporting is about consolidating, organizing, and formatting data. It is used to simply extract data and present it in its original form. Analytics, on the other hand, is concerned with examining, questioning, comparing, and identifying trends from the data collected.
– Output: Reporting generates facts about the performance of different functions within a company. Examples of these functions can include sales, marketing, production, and so on. Outputs usually follow a structured reporting template and timeline (e.g. daily, weekly, monthly, quarterly or annual reports). Analytics takes it a step further and provides insights, detects patterns, and generates recommendations.
– Roles: Reporting is simple and is usually automated. Managers and department heads use the reports to track the performance of their companies. Business leaders and decision-makers use analytics to develop strategies, create policies, and optimize various functions.
– Technology: Reports can be predefined extracts from operating system or they can be designed in spreadsheets like Excel and are usually presented using PowerPoint. The report creation process can be automated with technology, e.g. the use of ETL (Extract Transform and Load) tools to automate the data extraction and cleanup process from different sources, then the use of business intelligence software like Excel and Power BI to visualize the reports in charts and tables.
Analytics can also leverage the smae technologies use to create reports (Excel, Power BI, Tableau, Qlik etc), but they also go a step further by also making use of advanced technologies features and statistics to detect and visualize patterns in the data. Analytics also leverage the power of machine learning and natural language processing to speed up the process of getting to actionable insights and data-driven decisions.
Conclusion
While both reports and analytics deal with data, they do so in different ways. The simplest way to understand it is that reporting shows what is happening while analytics explains why it is happening.
Reports are critical in the management of a business, establishing a reporting rhythm is important, automating the generation of reports is also very critical. The time saved by automating the generation of your routine reports will enable you spend more time performing analytics, allowing you to examine, explore, and question your data. A successful business must use both to monitor the performance of various functions while making data-driven decisions.
Developing an efficient reporting and analytics system can be a difficult undertaking. At dbrownconsulting, we have years of experience building Analytic systems that automate your reports, standardizing how you communicate your numbers succinctly and coaching to better question your data through effective use of analytics. Have questions about how we can help your team save precious time? Contact us today.z
Connect with us
30.1k Subscribers
